

Effects of small deviations in flow rate on GPC/SEC results
Carlo Dessy, Testa Analytical Solutions e.K.
Published in Lab Asia – April 2025

The strength of GPC/SEC is inherently connected to its simplicity. A typical entry-level GPC/SEC system consisting of a pump, manual injector, a column, and a refractive index detector plus a few reference standards is all it takes to establish a reliable analytical method. The addition of more columns and mass-sensitive detectors such as a viscometer or/and a MALS, improve the analytical capabilities of such a system, to solving more complex applications and providing dense information content.
In GPC/SEC applications where a RID is the only available detector, results rely on a calibration curve obtained by running a set of reference standards with known molecular weight and narrow MW distribution.
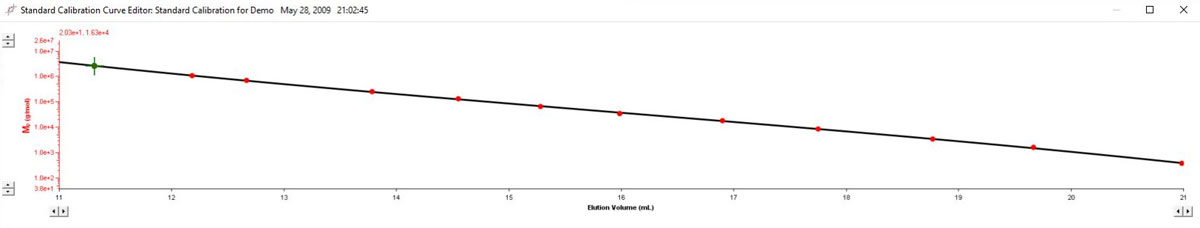
The calibration curve is built by plotting the nominal molecular weight versus the peak elution volume determined by measurement. Similarly, when a viscometer is used for detection, a universal calibration is built by plotting the product of nominal molecular weight and measured peak intrinsic viscosity versus the determined peak elution volume.
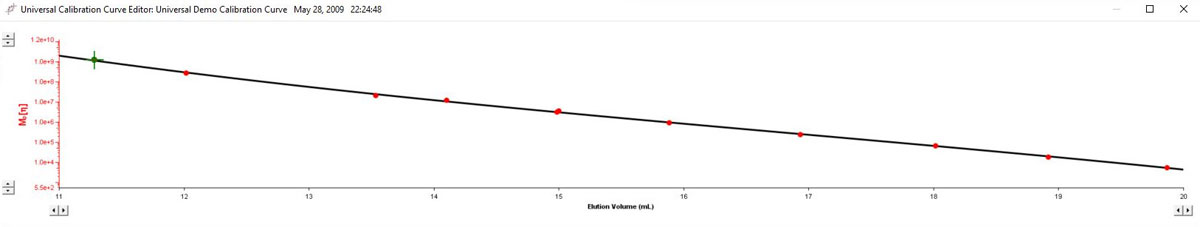
In both cases, determination of the molecular weight of an unknown sample is based on the determination or its elution volume and the corresponding value obtained from the calibration curve. It is important to keep in mind that GPC/SEC measurements are often time-consuming, ranging from around 45 minutes to several hours, depending on absolute flowrate and the number or columns utilised in the system. As such, it is customary practice to run the necessary standards and unknown samples on different days or even weeks, giving a very loose time relation between calibration and sample measurement. This considered, any deviation or flowrate between runs or standards and sample, will affect the final determined molecular weight.
The question then becomes 'How big is this influence?' and 'What deviation may I tolerate before a re-calibration is necessary?'
In a typical lab environment, flowrate accuracy is a matter or trust for most liquid chromatography pumps. Typically checked and validated only once a year, a liquid chromatography pump is widely believed to be capable of delivering the desired exact flow rate over a long period of time without deviations worth mentioning. Often, the backpressure reported by the pump is used as a reference and confirmation of perfect operation.
However, considering the number or parameters capable of influencing the reported backpressure (temperature, status of the columns and tubing, quality or solvent just to report a few) this parameter has limited meaning for expressing accuracy of flow in a long-term world (most GPC/SEC run 24/7 for weeks!) as a variation of 1% in total backpressure might seem to be not noticeable.
In this short article, we investigate the effect of a deviation of 1% in flowrate on results for an unknown sample determined with both a standard calibration and a universal calibration. We selected such a small variation as, translated into backpressure for a typical GPC/SEC system, it is often below the detection limit of the pressure transducer of the pump thus undetectable with on-board means.
ß The investigation has been done by running a sample right after calibration, performing calculations and subsequently manually changing the flowrate parameter used for calculation. This was then repeated for a second sample using a viscosity detection and universal calibration.
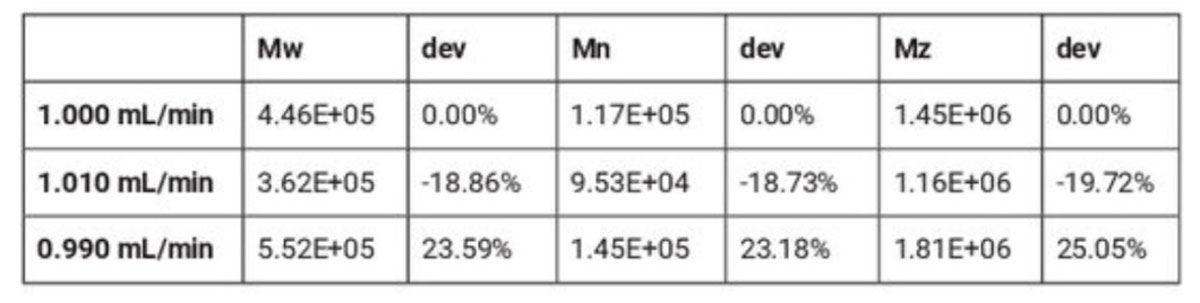
The following table clearly shows the impact of both positive and negative 1% error on obtained molecular weights. Nominal Flowrate (and the one at which the standards for calibration were run) was 1.000 mL/min. Calculations have therefore been performed at 1.000 mL/min, 1.01 mmL/min and 0.990 mL/min.
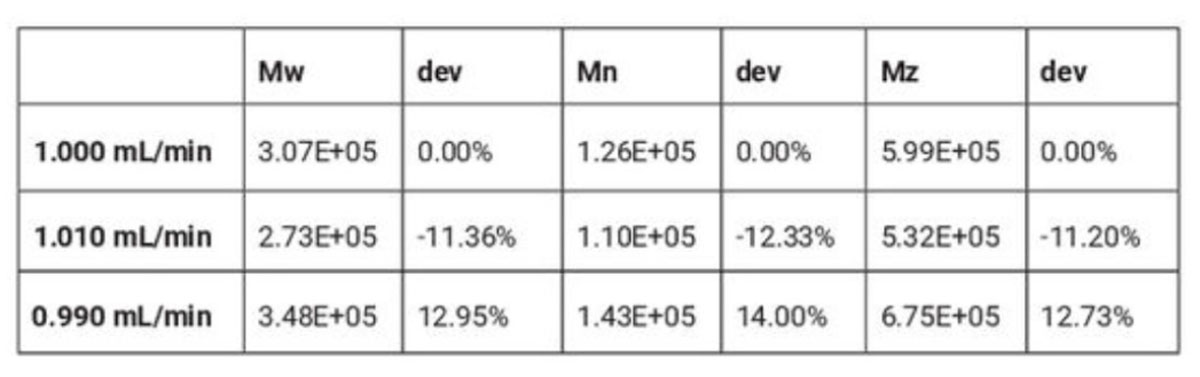
The results above show a 20% change in molecular weight results from just a 1% deviation in flowrate. This effect might be surprising at first, but it is however explicable by the fact that molecular weight on the calibration curve is a log value plotted versus the linear value of elution volume.
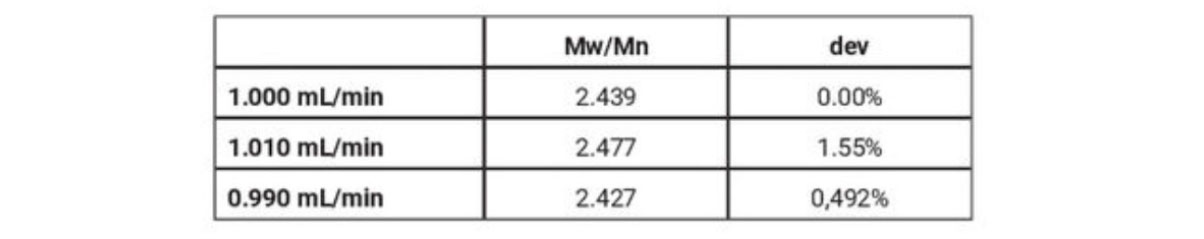
Results on Table 2 show that polydispersity is only slightly affected by the deviation in flowrate.
After having evaluated the effect based on a standard calibration, it is interesting repeating the evaluation based on a sample run against a universal calibration.

once again. positive, and negative 1 % deviations from the correct flowrate were examined, results are collected into Table 3 below.
Conclusion
The impact of a small flowrate deviation on GPC/SEC molecular weight determination is huge (over 40% total!) for a system using universal calibration as calculation base. This clearly underlines the necessity for a suitable method of constant monitoring of current flowrates and correction of running chromatogram.
These simple experiments demonstrate the importance of an accurate and over time constant flowrate while pointing out that traditional indicative parameters like backpressure reported by the pump, might not be sufficient for a reliable evaluation of the status of the pump itself and therefore of the flowrate currently delivered. The errors in the determined molecular weights are far too large to be simply ignored or accepted, in particular because modern means of continuous monitoring of the current flowrate are now readily available in the form of non-invasive flowmeters.
Thank You!
Your message has been forwarded to our team and we will reply as soon as possible. Thank you for your patience.
© 2026 TESTA Analytical Solutions e.K. All rights reserved.